
From 2016 to 2017, the home health and hospice markets both experienced growth, with millions of more Medicare beneficiaries utilizing these services, according to year-end data from Excel Health.
The data, which is based on the most recent Medicare Part A and Medicare Part B claims data, show there were 57.7 million Medicare beneficiaries residing in the United States by the end of December 2017, representing a 2.2% increase in this population from 2016. In the next 30 years, the number of enrolled beneficiaries will swell to 92.6 million, according to Excel.
Just five states make up 35% of all beneficiaries—California, Florida, Texas, New York and Pennsylvania. And some states are gaining Medicare enrollees at a faster clip than others, with Alaska, Idaho, Nevada, Colorado and Arizona seeing the highest growth rates in 2017 compared to 2016.
Discharge patterns
In 2017, nearly half—48.5%—of all patients who were discharged from a hospital didn’t receive post-acute care instructions. Patients who are discharged with instructions are slightly more likely to end up a skilled nursing facility (SNF) than home health care, 22% to 20%, respectively.
Hospice, inpatient-rehabilitation and long-term care hospitals make up 10% of all hospital discharges.

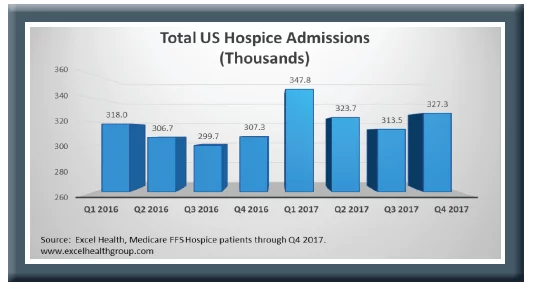
Hospice admissions
Compared to home health care, hospice had significant growth in 2017, with 1.3 million Medicare enrollees—a 6.5% jump from 2016. Almost half—47.5%—of enrollees were over the age of 84, while only 13% of admissions were for patients younger than 70.
“This suggests that, as the Medicare population grows older, hospice admissions will significantly increase even if no other change drivers (such as physician referral patterns or increasing numbers of hospices) are present,” the report reads.
Part of the growth in hospice utilization is attributable to the rise in the number of for-profit hospices, according to the Centers for Medicare & Medicaid Services (CMS). For-profit hospices made up 30% of the 2,255 hospices in 2000; by 2016, that proportion jumped to two-thirds of the nearly 4,400 hospices in operation. More awareness of hospice services may also be causing rise in use among Medicare enrollees.
North Dakota saw the highest admissions growth in 2017 compared to 2016, at 22.1%. Wyoming, Vermont, Montana and Virginia also had admissions growth rates above 12%. New York, Alaska, New Jersey, Georgia and the District of Columbia were the lowest gainers in hospice growth.
Hospice utilization in 2017 among Medicare enrollees inched up 1.4% from 2016, standing at 47.7% among Medicare decedents. Hospice expenditures rose to $17.5 billion last year.
The top five hospice terminal diagnoses in 2017 were:
- Alzheimer’s Disease
- COPD
- Heart failure
- Lung caner
- Senile degeneration of the brain
Home health insights
For the four quarters ending September 2017, there were 3.7 million home health admissions, just a 0.5% growth over the same time period in 2016, according to the data. Ten states saw declines in home health admissions, including four that are current subjects of CMS’ moratoria—Florida, Texas, Illinois and Michigan.
Of the 10 states that had home health admissions increases, nine were not Certificate of Need states, “suggesting that there are no significant barriers for new providers to enter the market,” the report found. Eight of the 10 had fewer than 100 active home health agencies in 2016, revealing expansion opportunities in some markets.

Idaho saw a 9% rise in home health admissions in 2017 from 2016, while Wyoming, Hawaii, New Mexico and West Virginia had the next highest rates of growth.
By comparison, Rhode Island’s admissions dropped 5.4%, followed by Florida (-4.5%); Illinois (-4.4%); Alabama (-4.3%); and Indiana (-2.2%).
From the third quarter of 2016 to the third quarter of 2017, home health utilization rates ranged by state, with a high of 14.7% utilization precipitated by direct physician referral in Florida, to a low of just 2.7% in Hawaii. Approximately three-quarters of all home health episodes originate with a physician visit and referral to home health without an inpatient stay, CMS estimates.
Florida, Massachusetts, Michigan, Connecticut and Mississippi had the highest utilization rates, ranging between 12% and 15%, which is not surprising given Florida’s high number of Medicare beneficiaries.
“FL also has the fourth largest number of practicing primary care physicians that contribute to its 14.7% utilization rate,” the report said.
However, California, Texas and Illinois had “surprisingly low” utilization rates compared to other metrics, the report said, as Texas has the most home health care agencies and more than Illinois and California combined. California, meanwhile, has the largest Medicare population in the nation and also the largest number of physicians to treat them, but is only ranked 7th for utilization from physician referrals.
Illinois, ranked 11th for overall utilization of home health services, has the fourth-highest number of agencies; is 7th in terms of beneficiaries and 6th for physicians.
“In these three high profile states with large Medicare populations, it would certainly seem that there is opportunity for providers to increase both their census and utilization of home health services,” the report concluded.

Written by Amy Baxter